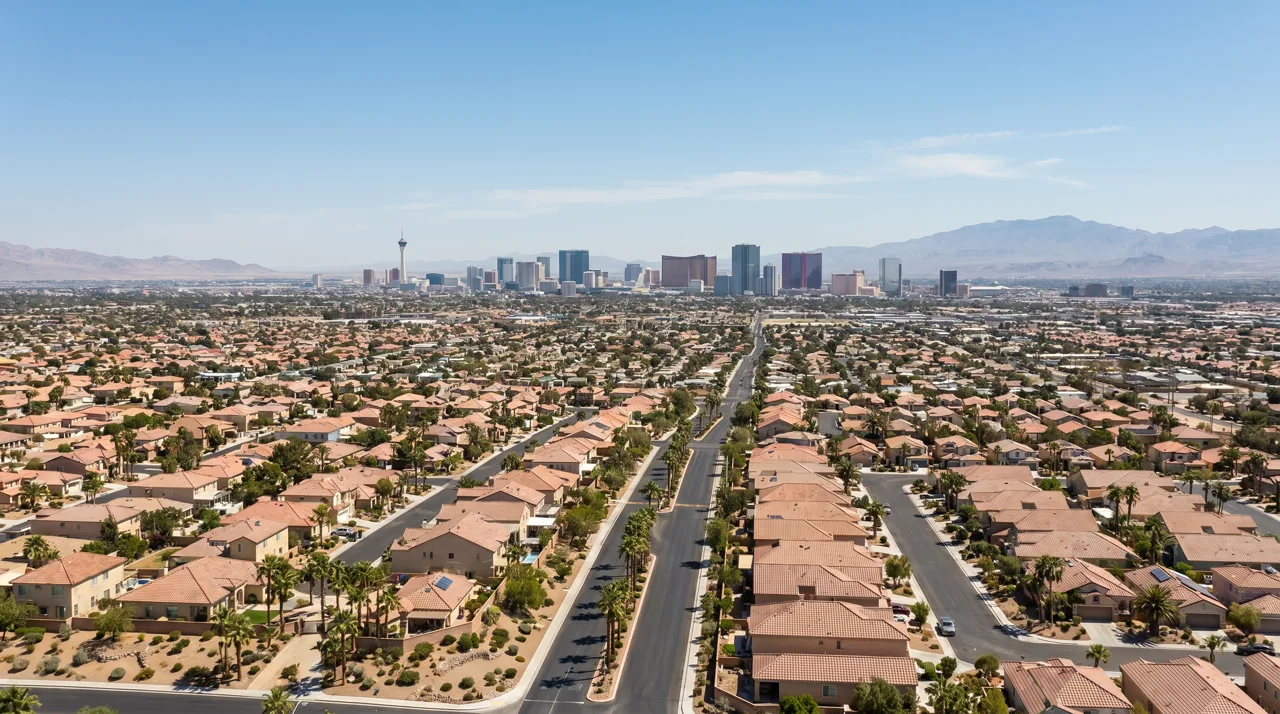
Las Vegas Cap Rates by Neighborhood for Investors
Most investors who call me about Las Vegas rentals open with the same question: "What kind of return can I get?" It's the right instinct, but it's the wrong first question. The number that actually tells you whether a property is worth chasing is the cap rate - and in this valley, cap rates swing hard from one submarket to the next. A single-family rental in a west-side master plan and a small multi-family building in the north valley are almost different asset classes once you run the math.
I've closed more than 600 transactions across Southern Nevada, and I spend a lot of time helping buyers separate what looks good in a portal search from what survives real underwriting. This article walks through how cap rates work, what they look like by neighborhood in 2026, and the local costs that quietly erase yield if you skip them. My goal is to give you a framework you can use before you ever write an offer.
One thing to keep straight from the start: a low cap rate is not automatically a bad deal, and a high one is not automatically a good one. Each number reflects a trade-off between cash flow, tenant stability, and long-term appreciation. Once you understand the trade-off, the neighborhood data starts to make sense.


What a Cap Rate Actually Measures
A capitalization rate is a simple ratio: net operating income divided by the property's value. Net operating income, or NOI, is your annual rental income minus the recurring costs of running the property - property taxes, insurance, repairs, a vacancy allowance, HOA dues, owner-paid utilities, and management. It does not subtract your mortgage payment. That's the key detail. Cap rate measures the property's unlevered return, so it lets you compare two buildings without the noise of different loan terms.
Here's the plain-English version. If a home produces $30,000 in NOI and you buy it for $500,000, that's a 6.0% cap rate. Buy the same income stream for $600,000 and the cap rate drops to 5.0%. Higher price, same rent, lower return. This is why premium neighborhoods produce low cap rates: the purchase price climbs faster than the rent does.
The financing environment makes this ratio more important than it was a few years ago. Freddie Mac's Primary Mortgage Market Survey put the average 30-year fixed rate at 6.49% as of July 9, 2026. That's a conventional owner-occupied benchmark, not an investor-loan quote, but it anchors the cost of capital. When borrowing costs sit in the mid-6% range and a property's cap rate sits below that, you're looking at negative leverage - the debt costs more than the asset earns before appreciation. That gap is the single biggest reason disciplined underwriting matters right now.
Tip: Cap rate tells you about the property. Cash-on-cash return tells you about your deal after financing. Run both, and stress-test the cash-on-cash number at a higher vacancy and repair assumption before you commit.
The Valley-Wide Baseline in 2026
Before neighborhoods, you need the market backdrop. The median price for an existing single-family home in Southern Nevada held at a record $490,000 in mid-2026, up about 1% year over year, according to Las Vegas REALTORS data. Condos and townhomes sat around $292,000, down roughly 4% from a year earlier. Inventory has loosened to about three-and-a-half months of supply - more room to negotiate than in 2021 or 2022, but not a distressed, price-cutting market.
Against that baseline, valley-wide cap rate ranges break down by property type and building class. These are market estimates, not guarantees, but they're the benchmarks I use when I first look at a deal.
| Property type & class | Typical cap rate range | What it usually means |
|---|---|---|
| Single-family, Class A (newer, prime location) | 4.5% - 5.5% | Appreciation play, low turnover, low vacancy |
| Single-family, Class B (stable, moderate age) | 5.5% - 6.5% | Balanced cash flow and stability |
| Single-family, Class C (older, value-add) | 6.5% - 8%+ | Higher yield, more management and repairs |
| Multi-family, stabilized | 5.0% - 5.4% | Institutional-style demand, tighter margins |
| Multi-family, value-add / distressed | 5.8% - 8.5% | Repositioning upside, execution risk |
The average multi-family cap rate valley-wide sat near 5.4% in the second quarter of 2026, down slightly from late 2025. Direct cap rate data on individual single-family rentals is scarce because those homes rarely trade as income properties, so location and condition do most of the work in setting the number.


The Luxury and West-Side Tier: Appreciation, Not Yield
Let me be direct about the trophy communities, because this is where I see the most misaligned expectations. The Ridges, MacDonald Highlands, Anthem Country Club, and Red Rock Country Club are generally the lowest going-in cap rates in the valley. These are appreciation and wealth-preservation plays, not high-yield income markets.
The reason is basis. In The Ridges, the three-month median sale price ran around $2.7 million heading into mid-2026. Even when gross rent looks large in dollar terms, it's small relative to what you paid. Add guard-gated prestige pricing, custom-home maintenance exposure, and a thin pool of tenants at ultra-luxury rent points, and the going-in yield stays compressed. Vacancy between high-end tenants can also run longer than in mid-market product, which further softens NOI.
Broader Summerlin is where I push investors to stop treating a name like a single market. Summerlin South's median list price sat near $890,000 in 2026, while Summerlin North came in far lower, around $525,000. The whole community carries cap rates in roughly the 3.5% to 5.0% band, but the more workable numbers usually come from older villages, condos, and townhomes rather than premium single-family estates. Rents run about 25% above the valley average, which helps, but high entry prices and layered HOA dues keep the ratio tight.
Henderson tells a similar story with a bit more breathing room. The median single-family price sat near $540,000 in mid-2026, and desirable areas like Green Valley typically produce single-family cap rates in the 4.0% to 5.0% range. Multi-family in Henderson runs steadier, roughly 5.0% to 6.5%. The draw here is stability and tenant quality - long-term renters, low turnover, and predictable income - not aggressive monthly cash flow.
Where the Cash Flow Lives
If your strategy is monthly income rather than long-term appreciation, the math points elsewhere. North Las Vegas consistently shows the most favorable rent-to-price ratios in the valley. The listing median sat around $425,000 in 2026, materially below both the city of Las Vegas and the valley-wide sale median. Multi-family cap rates here can range from 6.5% to 8.5%, especially for value-add buildings where you can raise rents after improvements.
Those higher returns come with a trade. Cash-flow-focused neighborhoods often mean more intensive management, more turnover, and more hands-on maintenance. The yield compensates you for the work - it isn't free money.
The southwest valley and the emerging Downtown Arts District each occupy a middle ground. The southwest corridor has newer housing stock and strong rental demand tied to proximity to the Strip and employment centers. Downtown appeals to a younger renter pool and carries a higher-risk, higher-reward profile for multi-family investors betting on continued redevelopment. Neither is a guaranteed high-yield play, but both can pencil better than the trophy communities for the right buyer.
| Submarket | Typical cap rate profile | Best-fit strategy |
|---|---|---|
| The Ridges / MacDonald Highlands / country clubs | Lowest in valley (often below 4%) | Appreciation, wealth preservation, executive rentals |
| Summerlin (broad) | 3.5% - 5.0% | Appreciation; attached/older stock for better yield |
| Henderson (broad) | 4.0% - 5.0% SFR; 5.0% - 6.5% multi-family | Stability, long-term tenants, low turnover |
| North Las Vegas | 6.5% - 8.5% multi-family | Cash flow, value-add |


The Cap-Rate Killers Most Overviews Skip
Here's where deals fall apart after they look great on paper. The headline rent can be attractive, and the property can still fail once you underwrite the real expenses. Three costs deserve special attention in this valley.
HOA dues
In Las Vegas master-planned and gated communities, layered association dues are often the decisive variable. A property can sit under a master association, a sub-association, and a separate club or amenity charge all at once. Anthem Country Club is a clear example: the community association's 2026 assessment reached $370.50 per quarter per household, and the total quarterly assessment including the Anthem Community Council portion came to $626.46 - before any golf-club membership charges. Summerlin's 2026 master assessments ran in the $69 to $76 per month range depending on the village, and those sit beneath any sub-association dues. Every dollar of HOA cost comes straight out of NOI, which is exactly why high dues plus a high basis is the reason so many luxury Las Vegas properties underperform on cap rate. Our neighborhoods guide can help you see how these community structures differ.
Property taxes and the abatement cap
Clark County property taxes are moderate by national standards, but the mechanics matter. Tax is based on 35% of assessed value multiplied by the district rate. Nevada also applies a partial-abatement structure with annual tax-increase caps - generally 3% for an owner's primary residence and up to 8% for other properties, including rentals. The Clark County Assessor's tax-abatement rules are worth reading closely, because a post-sale reset and the non-owner-occupied cap can change your forward tax picture. Don't underwrite a rental using the seller's owner-occupied tax bill.
Insurance
Insurance isn't a coastal-style crisis here, but premiums are rising and the cost varies more by construction type and HOA master-policy structure than by ZIP code alone. Nevada's home-insurance premiums grew about 10% in a recent reporting year, and condo and manufactured-home segments saw meaningful approved rate changes. For attached product, the interplay between the association's master policy, your unit policy, and loss-assessment exposure can move your carrying cost significantly.
Nevada's low property taxes do not rescue a bad rent-to-price ratio. I've watched investors assume the tax advantage would carry a marginal deal, only to find the HOA and insurance drag pulled the yield right back down. Run every line item.
Short-Term Rentals Are Not a Cap-Rate Shortcut
A lot of investor marketing projects Airbnb income to make a low cap rate look better. That's one of the biggest traps in this market, because short-term rental viability depends on jurisdiction, not neighborhood demand. "Las Vegas" can mean the City of Las Vegas, unincorporated Clark County, Henderson, or North Las Vegas - each with its own rules.
Most of Summerlin, for example, is regulated by the City of Las Vegas or unincorporated Clark County, and short-term rentals are restricted or excluded in many of those master-planned areas. Clark County adopted its short-term rental ordinance in June 2022 after state law required a licensing process, and it is illegal to rent for fewer than 31 days in unincorporated Clark County without the proper license. Henderson requires annual registration and its own compliance steps. On top of all that, HOA governing documents can prohibit short-term use even where the city or county allows it.
The practical takeaway: projected short-term rental income is not comparable across neighborhoods unless you've confirmed the jurisdiction and the license path first. For most of the premium communities in this article, a long-term rental strategy is far more viable and far less risky. If you're modeling short-term revenue, underwrite the deal a second time as a conservative long-term rental so you know the property survives if the short-term plan doesn't.
Tip: Before you assume any Las Vegas property can operate as a short-term rental, confirm three things in writing: the jurisdiction's licensing rules, the property's zoning eligibility, and the HOA's recorded restrictions. All three have to line up.


Matching Strategy to Submarket
Once you understand the trade-offs, neighborhood selection becomes a strategy decision rather than a hunt for the single highest number. Here's how I frame it with clients:
- Appreciation focus: Henderson and Summerlin tend to fit. You accept compressed cap rates in exchange for stable, long-term tenants, low turnover, and property that holds value.
- Cash-flow focus: North Las Vegas offers the most favorable rent-to-price ratios, with the understanding that management is more hands-on.
- Value-add focus: Older multi-family in central Las Vegas can produce repositioning upside for investors willing to underwrite renovation and lease-up risk carefully.
- Tenant-quality focus: Premium communities trade yield for lower turnover and less wear-and-tear, which some investors value more than a higher headline return.
The contrarian point I keep coming back to is this: many Las Vegas investors don't have a cap-rate problem. They have a neighborhood-selection and expense-underwriting problem. In a mid-6% rate environment, that distinction is the difference between a property that looks good in a search and one that holds up when you run the real numbers. If you want to sketch monthly payment scenarios as you compare submarkets, our mortgage calculator is a useful starting point, though remember investor loan terms differ from the conventional benchmark.
A few pitfalls I'd flag one more time before you shop. Don't treat "Summerlin" or "Henderson" as a single cap-rate market - the segmentation within each is enormous. Don't confuse appreciation potential with income performance; they're separate goals. And don't spend every dollar on down payment and rehab. Reserves are part of the real purchase price, because pool homes, HVAC systems working through desert summers, and irrigation all create uneven maintenance timing that a thin bank account can't absorb.
Bringing It Together
Las Vegas cap rates by neighborhood come down to one clear divide. The trophy communities - The Ridges, MacDonald Highlands, Anthem Country Club, Red Rock Country Club - are prestige-driven, low-yield markets built for appreciation and wealth preservation. Broader Summerlin is mixed, with attached and older stock outperforming premium single-family on yield. Broader Henderson is generally a steadier cash-rate hunting ground than the elite gated enclaves. And North Las Vegas leads the valley on rent-to-price ratios for investors who want monthly income and don't mind the extra management.
Whatever tier you target, the winning move is the same: underwrite conservatively, verify the HOA and jurisdiction rules in writing, and reset your tax and insurance assumptions for a non-owner-occupied property. The number that survives that process is the one worth chasing. As an agent who has worked both the cash-flow north valley and the luxury west side, I'm glad to walk through the specific math on any property you're weighing. If we can help you think it through, reach out through my contact page - no pressure, no timeline, just a straight conversation about the numbers.
Categories
Recent Posts